
Benchmarking your website performance against competitors and the wider industry has been a challenge over the years. Luckily Simliarweb is here to make it a breeze.
How can you benchmark your website performance against competitors when you don’t have access to their Google Analytics I hear you ask? Thankfully, there are many website analytics tools out there to help and here at Anything is Possible we use one of the leading competitor benchmarking tools, Similarweb. We’ve put together this overview of some of the meaningful features available which can help you deliver actionable insights on website performance.
Cross-Browsing Behaviours
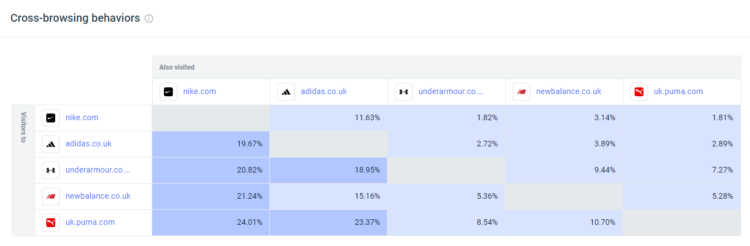
Similarweb introduced the Cross-Browsing Behaviours feature to provide users with an average percentage of users who have visited a website and then gone on to visit another website on the same day over a certain time period.
This insight allows you to understand how your audiences interact with your website and your competitors and how much competition there is in your key markets.
In the example below, we see that over the last 12 months the highest cross-variation was seen between Puma and Nike, where on average 24.01% of website users who visited uk.puma.com also visited nike.com on the same day. Additionally, we also see a high percentage cross-variation between Puma and Adidas (23.37%) and New Balance and Nike (21.24%).
Website Audience Loyalty
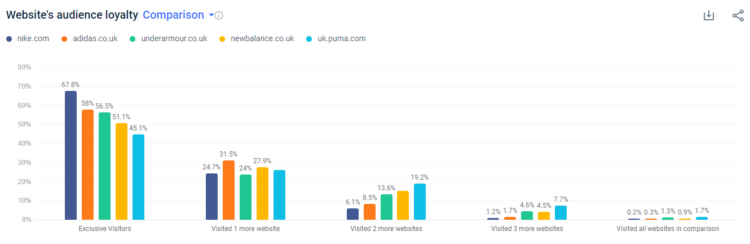
Similarweb also has the ability to measure website loyalty. This feature delivers a breakdown for each website based on the number of additional websites visited. A websites loyalty is measured through the logic that sites with fewer additional websites visited have greater loyalty – which is expressed as a percentage.
This insight helps you to understand the proportion of monthly active users who have exclusively visited your website, whilst also understanding audience behaviour when they are visiting multiple websites.
Using the same brands as before, we can see in the example below that Nike has the highest percentage of website users who exclusively visited nike.com in the UK (67.8%). Conversely, we see that Puma has the lowest percentage of exclusive visitors (45.1%) across the competitor set, but has the highest percentage for website users who have visited 2 more websites (19.2%), 3 more websites (7.7%) and visited all websites in comparison (1.7%).
Paid Search Analysis
Similarweb’s Paid Search Analysis feature allows you to gain insights into your competitors’ search marketing strategies by analysing their paid search campaigns. This feature also provides data on the keywords that competitors are bidding on, the ads they are running, and the landing pages they are directing traffic to.
This allows you to monitor your competitors’ paid search activities, identify their strengths and weaknesses, and make informed decisions on your own search marketing strategies. The data can be filtered by country, device, and time frame, giving you a detailed understanding of your competitors’ activities across different segments. It also provides an estimate of competitors’ monthly advertising budget, which can help assess the level of competition in your industry – making it a really powerful tool for you to stay ahead of the competition.
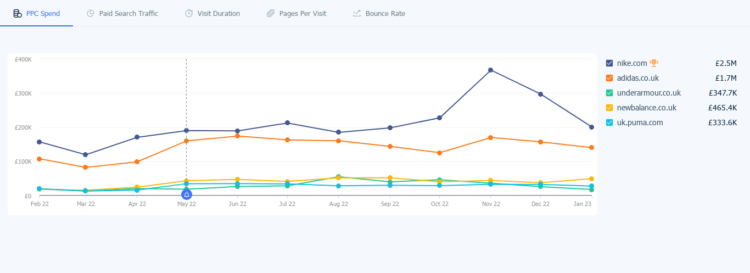
When we analyse the chart below, we can see that nike.com have invested the highest spend in PPC activity with £2.5m over the last 12 months in the UK, filtered for Desktop devices. Additionally, we can see how much nike.com is investing in PPC activity by month – investing heavily in November 2022 with £366.9k. By comparison, over the last 12 months underarmour.co.uk, newbalance.co.uk and uk.puma.com are investing far less in PPC activity when benchmarked against nike.com and adidas.co.uk.
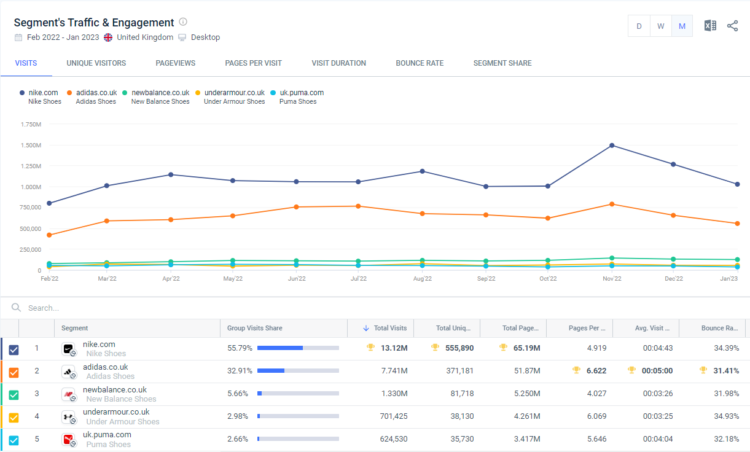
Website Segment Analysis
The tool’s Website Segment Analysis feature allows you to compare your website’s performance against your competitors within specific website segments, such as URL folders or strings. This feature provides insights into the performance of different websites in the same industry, helping brands to understand their position and identify areas for improvement.
By analysing metrics such as traffic sources, engagement, and bounce rates, you can benchmark your website against your competitors and gain insights into the tactics used by top performers in their industry. This data can be used to develop a more effective digital marketing strategy, improve user experience, and optimise website performance.
Using our same brands below, we have segmented the website URLs to include website traffic where “shoes” appears in the URL string. As we can see nike.com (Nike Shoes) has the highest Group Visits Share, Total Visits, Total Unique Visitors and Total Page Views. However, despite seeing less website traffic in comparison to nike.com, adidas.co.uk (Adidas Shoes) saw higher levels of engagement in terms of Pages per Visit, Avg. Visit Duration and also a lower Bounce Rate over the last 12 months.
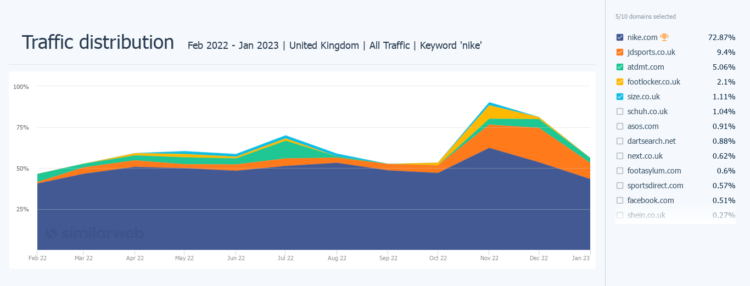
Search Interest Analysis
Similarweb’s Search Interest Analysis feature allows you to analyse search trends for any keyword, topic or category in order to understand the level of interest and competition in a particular market. This feature provides insights into the most popular search terms and the relative share of search website traffic, which can help identify potential growth opportunities and inform marketing and content strategies.
With this feature you can also see the top websites and apps that are receiving the most search traffic for a particular keyword, and compare their performance against competitors. This allows you to identify areas of weakness and focus on improving online presence to attract more website traffic. This helps you stay ahead of the competition and make data-driven decisions to improve your online visibility.
Looking at the example below, when we take the search keyword ‘nike’, we can see that a high percentage of website users are going to nike.com (72.87%) over the last 12 months in the United Kingdom. Additionally, we see that retail brands such as jdsports.co.uk (9.4%) and footlocker.co.uk (2.1%) also feature prominently in the top website domains for traffic distribution.
Similarweb provides valuable insights into website traffic, audience demographics, and online marketing strategies. Its data-driven approach helps brands make informed decisions, optimise their digital presence, and stay ahead of the competition. Want to stay two steps ahead of the competition? Get in touch with Ben to find out how Similarweb and our Marketing Intelligence team can help.
To learn more, check out Ben’s blog on Understanding Market Intelligence.