

Attributing value to a marketing campaign has to be the holy grail for any agency/client relationship. Can share of search (SOS) be a useful crystal ball for market impact when other tools and metrics struggle?
Accuracy and availability of data often come at a price. It can become nearly impossible to decipher the impact of a campaign with multiple offline, directly ‘unattributable’ elements.
Pre-, during and post-flight brand awareness analysis surveys are flawed and expensive. Asking an individual if they recall or recognise a brand always brings up behavioural biases:
What does the interviewer want me to say? What don’t they want me to say? Do I want to be the kind of person who answers this question this way?
With all those complicating factors in play, how can we really know how impactful our campaigns have been?
We know from the marketing juggernauts of the industry that share of voice (SOV) directly relates to market share. Peter Field and Les Binet showed that if a brand’s share of voice exceeds their share of the market through positive excess share of voice (positive ESOV) then if maintained over time – market share will rise.
Fantastic. But where do we begin to calculate SOV?
Like many great marketing theories, they are based on scenarios that tend to exist in a vacuum devoid of any real world factors.
For example, let’s try and calculate share of voice:
How to start to understand our SOV? We need to look at the ‘category’ and what competitors in the category are spending on ads. But how can we decipher who is in our category?
If we take the same flaw in our SOV category calculation – that is – consumers often go ‘off piste’ with what they choose. In the real world, people don’t fit our neat ideas of market logic and how they ‘should’.
Because consumer intent is unpredictable.
For example, a family may be looking for outdoor camping supplies to take the kids away for the weekend. But in the toy store, instead of buying a tent they know is on special offer, they spot a trampoline. The trampoline is a more reliable and more frequent means of keeping the kids occupied. So they drop the tent idea and buy the trampoline.
Two products, two different categories. But in the consumer’s world, the one solution to the same problem.
Brands we never think of as category competitors are always in play.
If we therefore take this unpredictable turn of human behaviour – customer intent – and flip it into our most significant metric, we turn to Search.
Search is the channel of greatest intent for answers. Google, in their own words, are “the world’s biggest database for human intentions”, with data on what we think, feel, want and do.
So Mark Ritson suggests we use Share of Search to understand impact over Share of Voice.
In its simplest formula:
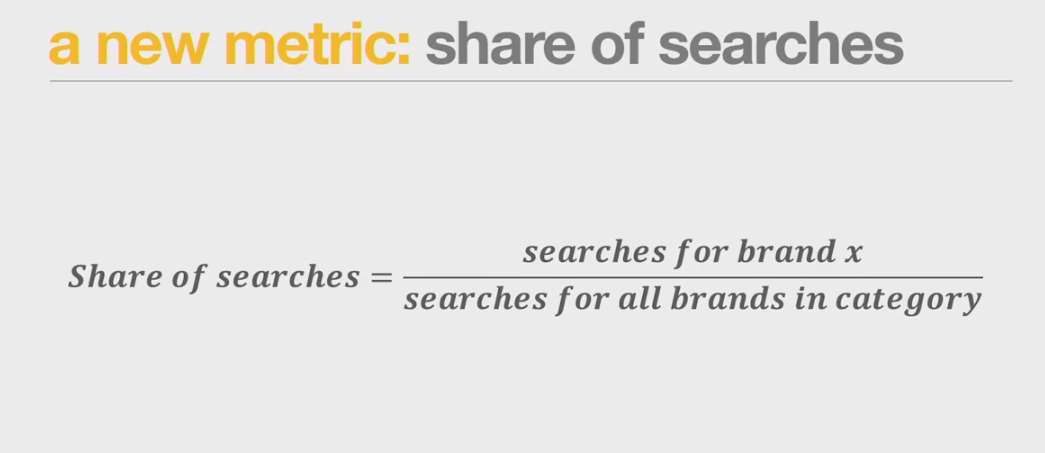
In basic principles, you gather search data for your brand, and then the brands you compete with.
Aggregate that, and you can see your share of search for the category from your brand search volumes for your brand.
This is a metric for tracking relative INTEREST in your brand.
This sits somewhere in between brand salience and brand consideration.
Share of search has strong correlation with market share.
But does that correlation imply causation?
Les Binet reviewed this and confirmed that search is indeed a leading indicator of market share.
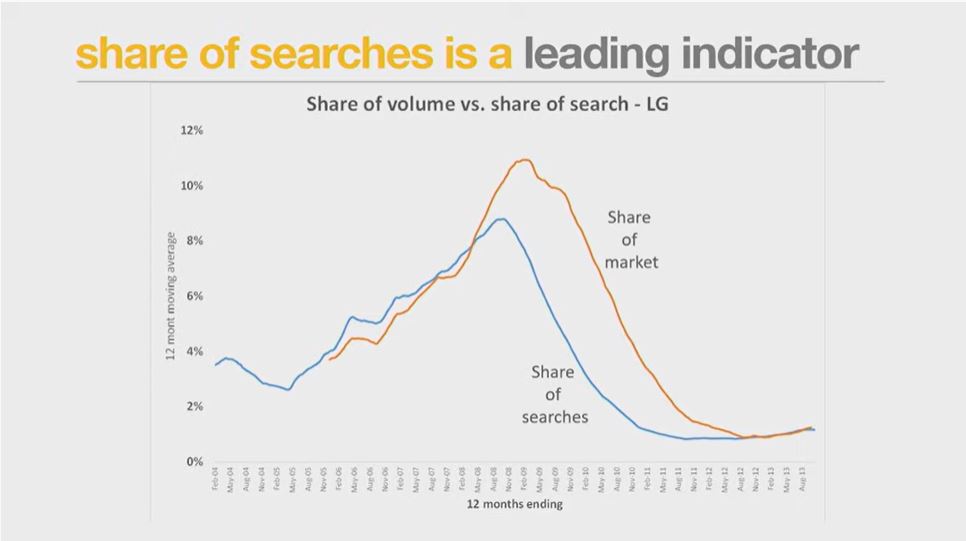
In this example of LG, we can actually even see that SOS can be used as an indicator to predict where market share will fall – in this case 6 months later.
This information is key here in understanding what can be done to reverse the slump shown in the graph.
Now the concept of Share of Search isn’t something new to us. We’ve been using this logic within our proprietary tool aipaware to measure brand interest and awareness for years now.
Using search, social and economic data we can compare brands, topics/interests, news stories and even political support by demographic and geo-locations.
In fact, we can measure and compare pretty much anything with search data at the heart.
The tool generates an interest & awareness index. For our clients, we use this data to inform our media planning and buying strategies, identifying the right areas to target, and developing the media mix that will make the biggest impact.
We also use it to understand the impact of our campaigns. Has search demand shifted? Have we moved the dial on aipaware in the regions our campaigns were most visible? Has our share of search increased?
But it’s for predictions in long term market share where we can really begin to develop the idea. Les Binet found that share of search can predict changes up to a year in advance.
And that let’s us ask – and answer – some really exciting questions.
In these current times of uncertainty, if you could use search data today to look a whole year into the future of your brand’s market share, what would you want to know?
If you’re not sure, get in touch with me and we’ll talk it over.